Translate

Mostrando postagens com marcador demonstrações financeiras. Mostrar todas as postagens

23 outubro 2015

Demonstrações Contábeis ainda são úteis? Sim!

As demonstrações contábeis divulgam o desempenho passado das empresas. No entanto, quando os investidores tomam a decisão de comprar ou vender uma ação , eles estão interessados no desempenho futuro. Além disso, a mensuração contábil é sujeita a uma série de escolhas arbitrárias e não é capaz de capturar o valor dos ativos intangíveis. Por consequência, há distorções nos números divulgados, o que pode prejudicar a capacidade de indicar a perfomance de uma empresa.

O mundo vive uma era de abundância de informações. O custo de produzir, disseminar e obter informação diminuiu drasticamente. Assim, os investidores e analistas de mercados têm acesso a uma série de dados, informações e notícias sobre as empresas. Num ambiente como esse, será que as demonstrações contábeis são úteis para alguma coisa?

Para responder essa pergunta Beaver(1968) sugeriu quantificar a nova informação oriunda das demonstrações no momento de sua divulgaão, mensurando a mudança no preço da ação da fima após esse evento. Se a informação for velha, o mercado terá incorporado essa informação e o movimento será mínimo.

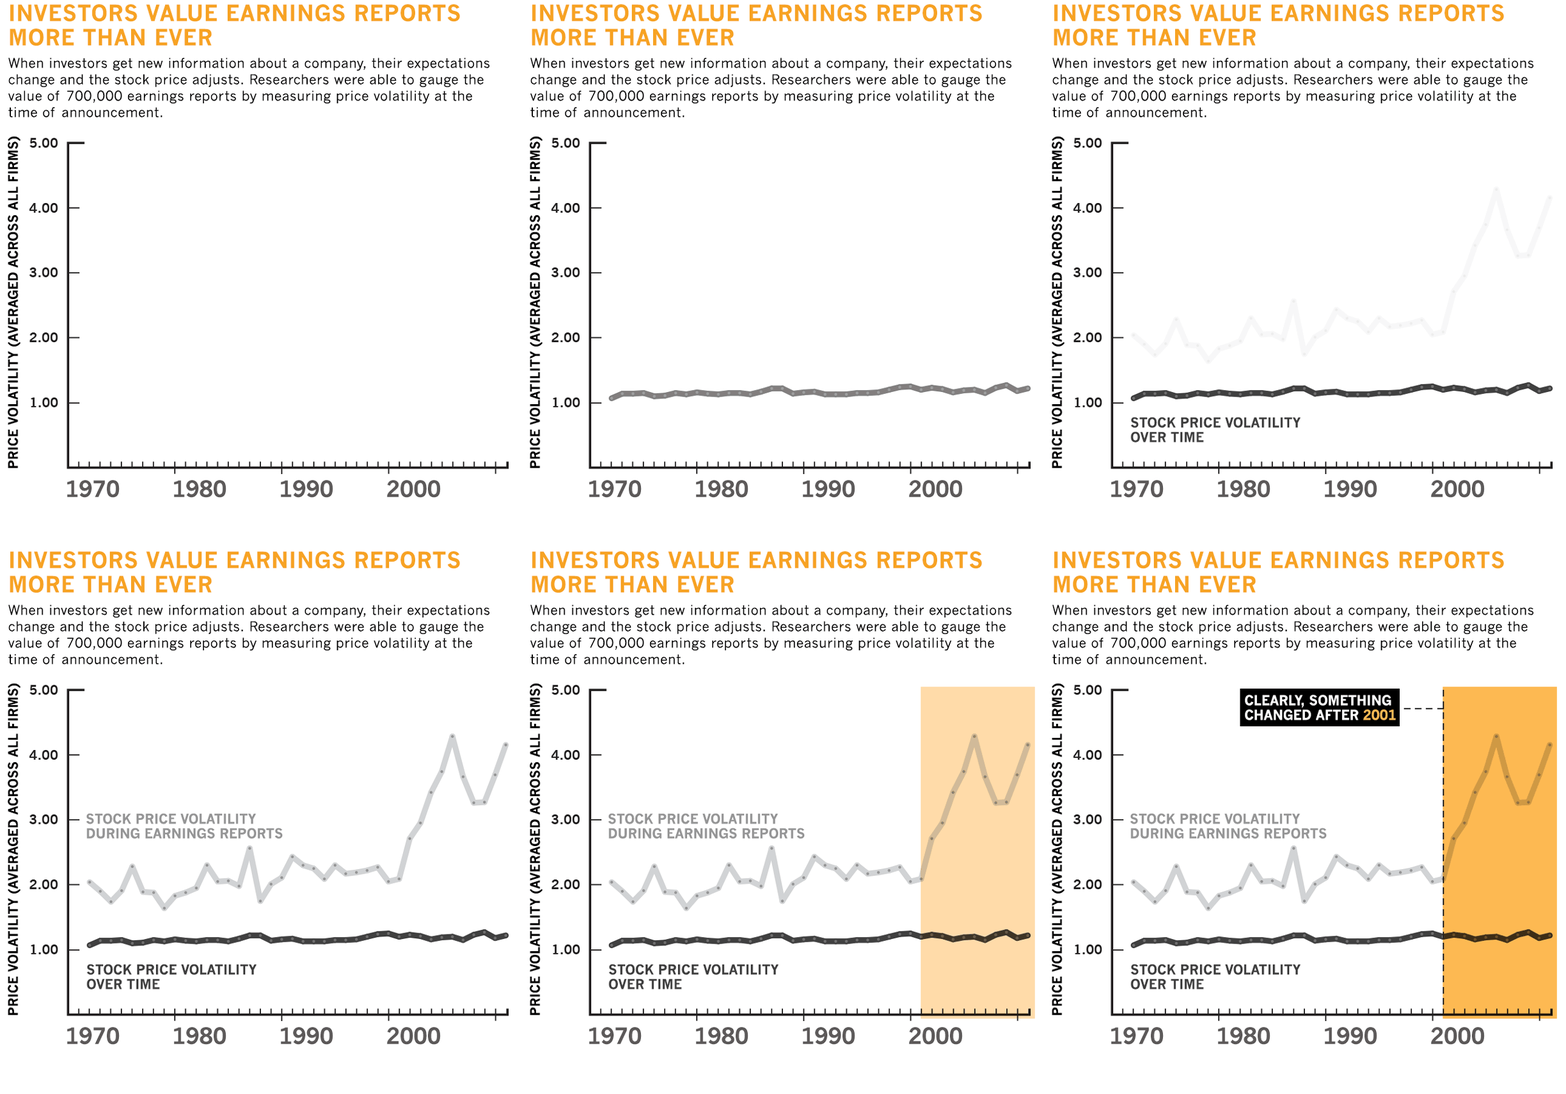
Num artigo bem recente  Beaver e colaboradores usaram essa análise com uma amostra de 700 mil demonstrações trimestrais de 1970 a 2011. O objetivo foi verificar se houve movimentação siginificativa das ações após a divulgação da demonstração de resultado. Os autores constataram que as mudanças de preços foram mais expressivas perto do dia de divulgação. A volatilidade dos preço das ações no período de divulgação foi em média de 2,54, enquanto no período que não houve divulgação foi de 1,58. Além disso, observaram que no período de 2002 a 2011 a volatilidade dos preços no dia de anúncio aumentou substancialmente. Em outras palavras, o valor da informação contábil cresceu na era da Internet. Isso talvez possa ser explicado por mudanças nos padrões contabéis e/ou mudanças regulatórias que aumentaram a confiança do público nas informações.

Fonte aqui


The Information Content of Earnings Announcements: New Insights from Intertemporal and Cross-Sectional Behavior
By William H. Beaver, Maureen McNichols, Zach Z. Wang


March 14,2015Working Paper No. 3338

This study examines the information content of quarterly earnings announcements. We first use a nonparametric approach to investigate whether quarterly earnings announcements are informative between 1971 and 2011 and find unequivocal evidence that earnings announcements convey significantly more information relative to non-announcement periods. We also find that the information content increases over time with a dramatic increase from 2001 onward, a period that includes the implementation of Sarbanes Oxley reforms and the worst economic downturn since the Great Depression. We then investigate cross-sectional variation in information content. We find that the information content of earnings announcements is positively associated with profitability, firm size and analyst coverage.

Fonte: aqui

06 janeiro 2015

Ilusão da comparabilidade e "auditibilidade" nas Demonstrações Financeiras

Tom Selling, membro do Standing Advisory Group do PCAOB, argumenta que não há comparabilidade e "auditibilidade" das demonstrações financeiras. A argumentação é embasada com um exemplo sobre o teste de impairment. O texto é excelente.

My inspirations for this post are the maiden speech of the SEC’s new chief accountant James Schnurr, and the joy of paying only $2.02/gallon at the pump.
As for Mr. Schnurr, I plan to dissect his remarks more fully in a blog post to come, but for now I’ll confine my review to his mentioning comparability of financial statements no less than seven times, e.g., “Comparability is a hallmark of U.S. financial reporting…”
As to the relevance of my satisfying gas station experience, the financial reporting implications of the 50% decline in oil prices over the past six months make for a timely illustration for why Mr. Schnurr’s statements about comparability are nothing more than hot air.

Why Comparability of Financial Statements is an Illusion

There are many, many reasons why financial reports are not comparable.  Tops on my list, though somewhat off topic, is the absence of adjustments for inflation.  No respectable economist would ever dream of comparing trends in costs or revenues without adjusting for inflation; so it really irks me that in accounting, we never adjust for inflation.
Truly, by ignoring the necessity for inflation adjustments, it makes the accounting profession (including our august chief accountant) look like a bunch of simpletons.  Some will argue over implementation details, but accounting for inflation is no harder or easier than dealing with multiple currencies (yet, see here and here for how the FASB managed to screw that up, too).
Adjustments for inflation are merely a pre-condition for making comparisons. Let’s get back to the drop in O&G prices that have made many of us joyous, but must surely frustrate the managers of companies whose recent investment decisions were predicated on higher and steadier prices.  These managers have many hard operational and strategic choices to make; and to make matters worse for them — e.g., the threat to their earnings-based bonus checks — they also have to deal with the accounting question of asset “impairment.”

[...]

But seriously, the above example plainly illustrates that even the most assiduous application of GAAP will not produce comparable information.  Impairment is just one of many examples that we can all think of.

Why Financial Statement Audits are an Illusion
Which brings me to the second, and main point that I want to make: the impairment test is not auditable.  

[...]

Financial accounting standards like the one for the impairment of long-lived financial assets defeats, instead of promotes, comparability.  And, especially when facts and circumstances indicate to any extent that the past is not indicative of the future, not even the most independent and technically competent auditor on the planet could reliably assess the “reasonableness” of management’s estimates of variables like future oil prices.

[...]

Nothing I have written here concerning the lack of comparability of financial statements is something that Mr. Schnurr doesn’t already know.  Instead of disingenuously blowing smoke about comparability being a hallmark of U.S. GAAP he should at least be raising real issues and getting the PCAOB and FASB to actually do something about them.

05 janeiro 2015

Demonstrações Contábeis no R

Este post é uma pequena demonstração da utilização do programa R pra obtenção de demonstrações contábeis de empresas brasileiras. O código está na primeira parte do post. O output do R vem logo em seguida O pacote utilizado é o quantmod, que está em fase de renovação, pois as atualizações estavam paradas. As demonstrações podem ser obtidas pelo Yahoo Finance ou Google Finance a partir do ano de 2007.

Neste post, criei o objeto acoes com o símbolos de 6 empresas (CIELO,PETROBRAS,BRADESCO,CIA DE DISTRIBUIÇÃO,AMBEV, e BMFBOVESPA). Apresento o procedimento via Yahoo para a ação da Cia de Distribuição. Os dados das outras empresas que estão no objeto acoes podem ser obtidas com uma simples mudança do símbolo da ação desejada. É importante ressaltar que as informações são gratuitas, estão em inglês, mas não sei qual é o grau de confiabilidade.

O quantmod tem funções que permitem a execução de uma série de modelagens quantitativas em finanças. Assim, no fim do post apresento a série do preço de fechamento das ações da Cia de Distribuição.


#Instale e carregue o pacote Quantmod
library(quantmod)
 
#Faça o download das ações via Yahoo Finance 
acoes<-c("CIEL3F.SA","PETR4.SA","BBDC4F.SA","PCAR4F.SA","ABEV3.SA","BVMF3.SA")
getSymbols(acoes, src="yahoo",from="2007-01-01", to="2014-01-01")


#Vamos obter as seguintes demonstrações contábeis do Pão de Açúcar:1) Demonstrações de Resultados (Income Statements - IS).
#2 Balanço (Balance Sheets - BS) 3) Demonstração dos Fluxos de Caixa. (Cash Flow Statements - CF)
# AnuaL (Annual - A).# Trimestral. (Quarterly - Q).
 
#Obtêm as informações financeiras(preço de abertura,fechamento,volume,fechamento ajustado etc) de PCAR4.
getFin("PCAR4")
 
#Dividendos
PAO<-("PCAR4F.SA")
getDividends(PAO,src="yahoo")
 
#Visualize a Demonstração de Resultado Trimestral
viewFin(PCAR4.f,"IS", "Q")
 
#Obtenha o Balanço Anual para PCAR4
viewFin(PCAR4.f,"BS", "A")
 
#Obtenha as Demonstração dos Fluxos de Caixa Anual
viewFin(PCAR4.f,"CF", "A")
 
#Gráfico do preço de fechamento de PCAR4
chart_Series(Cl(PCAR4F.SA))
 
#Preço de Fechamento das últimas 3 Semanas
PCAR4F.SA<-last(PCAR4F.SA, "3 weeks")
chart_Series(Cl(PCAR4F.SA))
 
 
#Os mesmos comandos podem ser usados para outras ações listadas no objeto acoes. 


> getDividends(PAO,src="yahoo")
               [,1]
2010-04-30 0.393723
2010-05-18 0.080000
2010-08-04 0.080000
2010-11-18 0.800000
2011-08-02 0.090000
2011-11-16 0.090000
2012-04-30 0.410246
2012-06-12 0.110000
2012-08-01 0.110000
2012-11-13 0.110000
2013-04-18 0.653088
2013-05-06 0.130000
2013-08-01 0.130000
2013-10-28 0.130000
2014-04-17 0.588935
2014-05-06 0.140000

#Visualize a Demonstração de Resultado Trimestral
> viewFin(PCAR4.f,"IS", "Q")
Quarterly Income Statement for PCAR4
                                                 2014-09-30 2014-06-30 2014-03-31 2013-12-31 2013-09-30
Revenue                                            15648.67   15202.90   15008.64   16887.39   14106.85
Other Revenue, Total                                     NA         NA         NA         NA         NA
Total Revenue                                      15648.67   15202.90   15008.64   16887.39   14106.85
Cost of Revenue, Total                             11621.47   11253.87   11249.82   12666.14   10417.26
Gross Profit                                        4027.20    3949.03    3758.82    4221.25    3689.59
Selling/General/Admin. Expenses, Total              2894.91    2846.23    2729.12    2655.82    2673.36
Research & Development                                   NA         NA         NA         NA         NA
Depreciation/Amortization                            206.81     191.29     191.29     196.40     200.97
Interest Expense(Income) - Net Operating                 NA         NA         NA         NA         NA
Unusual Expense (Income)                              12.83      22.75       0.91      38.57      -7.50
Other Operating Expenses, Total                        5.04      42.16      26.68     260.09      23.57
Total Operating Expense                            14714.05   14328.84   14176.13   15798.06   13292.08
Operating Income                                     934.62     874.06     832.51    1089.33     814.77
Interest Income(Expense), Net Non-Operating              NA         NA         NA         NA         NA
Gain (Loss) on Sale of Assets                            NA         NA         NA         NA         NA
Other, Net                                          -562.25    -277.62    -283.31    -117.92    -431.80
Income Before Tax                                    557.12     512.92     493.49     761.46     503.21
Income After Tax                                     389.69     358.44     338.44     687.44     356.53
Minority Interest                                   -113.51     -94.14     -94.48    -195.72     -74.42
Equity In Affiliates                                     NA         NA         NA         NA         NA
Net Income Before Extra. Items                       276.18     264.30     243.96     491.72     282.11
Accounting Change                                        NA         NA         NA         NA         NA
Discontinued Operations                                  NA         NA         NA         NA         NA
Extraordinary Item                                       NA         NA         NA         NA         NA
Net Income                                           276.18     264.30     243.96     491.72     282.11
Preferred Dividends                                      NA         NA         NA         NA         NA
Income Available to Common Excl. Extra Items         276.18     264.30     243.96     491.72     282.11
Income Available to Common Incl. Extra Items         276.18     264.30     243.96     491.72     282.11
Basic Weighted Average Shares                            NA         NA         NA         NA         NA
Basic EPS Excluding Extraordinary Items                  NA         NA         NA         NA         NA
Basic EPS Including Extraordinary Items                  NA         NA         NA         NA         NA
Dilution Adjustment                                    0.00         NA         NA         NA         NA
Diluted Weighted Average Shares                      265.08     264.91     264.91     265.23     263.88
Diluted EPS Excluding Extraordinary Items              1.04       1.00       0.92       1.85       1.07
Diluted EPS Including Extraordinary Items                NA         NA         NA         NA         NA
Dividends per Share - Common Stock Primary Issue       0.00       0.00       0.00         NA       0.00
Gross Dividends - Common Stock                           NA         NA         NA         NA         NA
Net Income after Stock Based Comp. Expense               NA         NA         NA         NA         NA
Basic EPS after Stock Based Comp. Expense                NA         NA         NA         NA         NA
Diluted EPS after Stock Based Comp. Expense              NA         NA         NA         NA         NA
Depreciation, Supplemental                               NA         NA         NA         NA         NA
Total Special Items                                      NA         NA         NA         NA         NA
Normalized Income Before Taxes                           NA         NA         NA         NA         NA
Effect of Special Items on Income Taxes                  NA         NA         NA         NA         NA
Income Taxes Ex. Impact of Special Items                 NA         NA         NA         NA         NA
Normalized Income After Taxes                            NA         NA         NA         NA         NA
Normalized Income Avail to Common                        NA         NA         NA         NA         NA
Basic Normalized EPS                                     NA         NA         NA         NA         NA
Diluted Normalized EPS                                 1.14       1.14       0.99       2.20       1.05
attr(,"col_desc")
[1] "3 months ending 2014-09-30" "3 months ending 2014-06-30" "3 months ending 2014-03-31" "3 months ending 2013-12-31"
[5] "3 months ending 2013-09-30"

 
> #Obtenha o Balanço Anual para PCAR4.
> viewFin(PCAR4.f,"BS", "A")
Annual Balance Sheet for PCAR4
                                             2013-12-31 2012-12-31 2011-12-31 2010-12-31
Cash & Equivalents                              8024.06    6595.64    4969.95    3400.43
Short Term Investments                            24.45       0.00       0.00     600.61
Cash and Short Term Investments                 8391.63    7086.25    4969.95    4418.61
Accounts Receivable - Trade, Net                2515.67    2646.08    5111.94    4047.23
Receivables - Other                                  NA         NA         NA         NA
Total Receivables, Net                          3651.02    3728.57    6299.27    5205.57
Total Inventory                                 6381.54    5759.65    5552.77    4823.77
Prepaid Expenses                                  92.28      66.79     105.79     225.12
Other Current Assets, Total                       93.27      39.04      23.05       0.00
Total Current Assets                           18609.74   16680.30   16950.83   14673.07
Property/Plant/Equipment, Total - Gross        14083.14   12580.84     341.55   10370.19
Accumulated Depreciation, Total                -5029.54   -4466.34         NA   -3575.85
Goodwill, Net                                   2653.10    2058.34         NA    1975.09
Intangibles, Net                                3047.56    2917.22    4939.36    2940.89
Long Term Investments                            309.53     362.43     340.12     239.93
Other Long Term Assets, Total                   1988.14    2624.36    2342.61    2141.71
Total Assets                                   38008.35   34832.11   33443.45   29772.26
Accounts Payable                                8547.54    6240.36    5953.20    5368.74
Accrued Expenses                                 907.55     864.75     867.26     628.18
Notes Payable/Short Term Debt                      0.00       0.00       0.00       0.00
Current Port. of LT Debt/Capital Leases         5171.42    4211.15    4917.50    2915.12
Other Current liabilities, Total                2386.24    2075.01    1437.68    2011.40
Total Current Liabilities                      17012.75   13391.27   13175.64   10923.44
Long Term Debt                                  4123.34    6118.57    6046.11    5490.69
Capital Lease Obligations                        198.51     162.54     194.79     101.24
Total Long Term Debt                            4321.85    6281.10    6240.90    5591.94
Total Debt                                      9493.27   10492.25   11158.40    8507.05
Deferred Income Tax                             1060.85    1137.38    1114.87    1028.99
Minority Interest                               3228.77    2573.23    2469.15    2477.27
Other Liabilities, Total                        2900.93    2954.41    2817.60    2727.31
Total Liabilities                              28525.16   26337.38   25818.17   22748.94
Redeemable Preferred Stock, Total                    NA         NA         NA         NA
Preferred Stock - Non Redeemable, Net                NA         NA         NA         NA
Common Stock, Total                             6764.30    6710.03    6129.40    5579.26
Additional Paid-In Capital                           NA         NA         NA         NA
Retained Earnings (Accumulated Deficit)         2756.22    1784.69    1495.87    1444.06
Treasury Stock - Common                              NA         NA         NA         NA
Other Equity, Total                              -37.33         NA         NA         NA
Total Equity                                    9483.19    8494.73    7625.27    7023.32
Total Liabilities & Shareholders&#39; Equity   38008.35   34832.11   33443.45   29772.26
Shares Outs - Common Stock Primary Issue             NA         NA         NA         NA
Total Common Shares Outstanding                  264.22     263.17     260.03     257.63
attr(,"col_desc")
[1] "As of 2013-12-31" "As of 2012-12-31" "As of 2011-12-31" "As of 2010-12-31"

> #Obtenha as Demonstração dos Fluxos de Caixa Anual
> viewFin(PCAR4.f,"CF", "A")
Annual Cash Flow Statement for PCAR4
                                       2013-12-31 2012-12-31 2011-12-31 2010-12-31
Net Income/Starting Line                  1396.21    1156.44     719.66     585.93
Depreciation/Depletion                     865.42     834.11     706.49     446.13
Amortization                                   NA         NA         NA         NA
Deferred Taxes                              89.09     193.35     -57.12      32.47
Non-Cash Items                            1909.30    1033.15    1280.23     523.10
Changes in Working Capital                 631.93    2082.21   -1521.19   -1226.24
Cash from Operating Activities            4891.95    5299.26    1128.06     361.38
Capital Expenditures                     -1849.61   -1393.39   -1454.28   -1480.26
Other Investing Cash Flow Items, Total    -176.92      54.51    -171.22      52.27
Cash from Investing Activities           -2026.53   -1338.88   -1625.50   -1427.99
Financing Cash Flow Items                 5371.28    6297.69    6582.05    3863.34
Total Cash Dividends Paid                 -452.66    -186.39    -183.47    -151.41
Issuance (Retirement) of Stock, Net         16.24      21.31      22.97      35.12
Issuance (Retirement) of Debt, Net       -6519.35   -7976.69   -4772.16   -1204.38
Cash from Financing Activities           -1584.49   -1844.08    1649.39    2542.67
Foreign Exchange Effects                       NA         NA         NA         NA
Net Change in Cash                        1280.92    2116.30    1151.96    1476.07
Cash Interest Paid, Supplemental           720.51     913.10     336.13     182.81
Cash Taxes Paid, Supplemental                  NA         NA         NA         NA
attr(,"col_desc")
[1] "12 months ending 2013-12-31" "12 months ending 2012-12-31" "12 months ending 2011-12-31" "12 months ending 2010-12-31"

Preço de Fechamento nos últimos anos:
 

Preço de Fechamento nas últimas 3 semanas